Oil Just Broke $90 — What It Means for Stocks, Inflation, and the Fed
WTI crude closed at $90.90 on Friday.
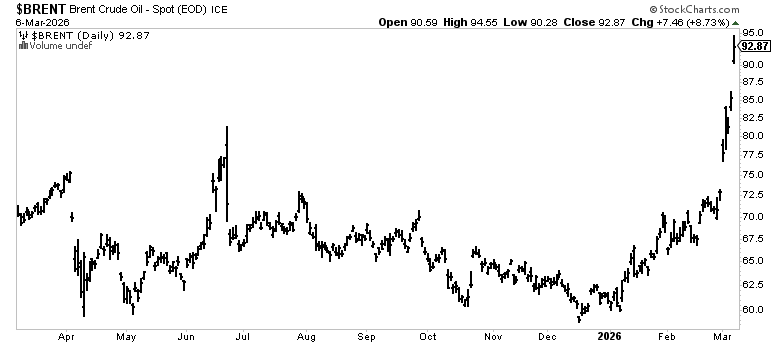
That's a 35% surge in one week — one of the sharpest weekly spikes in oil futures history. Brent crude settled at $92.87.
This isn't a normal energy trade. The Strait of Hormuz — the narrow waterway through which roughly 20% of the world's oil supply flows every day — is effectively shut down. Multiple tankers have been attacked in recent days, and the world's largest container shipping lines have halted all transits through the waterway. Commercial traffic has ground to a standstill.
Every advisor's phone is ringing with the same question: what does this mean for my clients?
Let's look at the data.
What History Says About Oil Shocks and Stocks
This is not the first time oil has spiked on a geopolitical crisis. Three modern parallels give us a framework:1990 — Gulf War
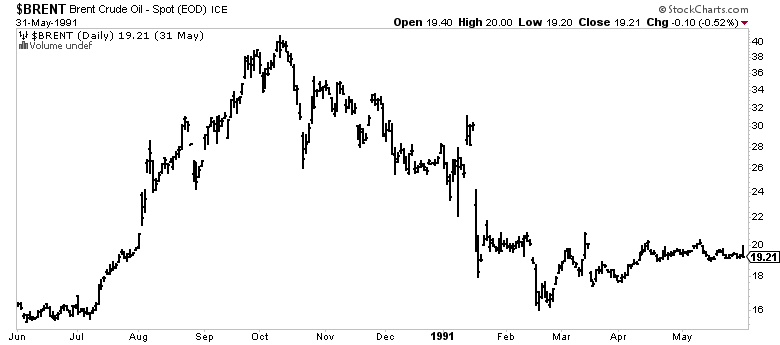
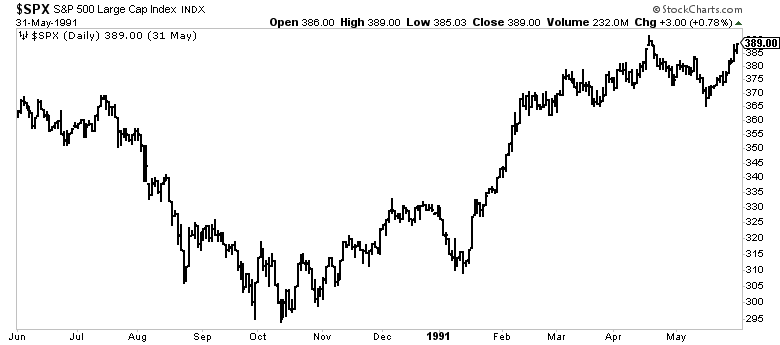
Iraq invaded Kuwait on August 2, 1990. Oil roughly doubled from $17 to $36/barrel in three months as markets priced in a prolonged Middle East conflict. The S&P 500 fell 19.9% from its July peak to its October low — just short of a technical bear market. The U.S. entered a mild recession that lasted eight months.
Then it reversed. When Desert Storm launched in January 1991, the conflict ended in six weeks. Oil crashed 33% in a single day and fell back below $20 by March. The Dow rallied 17% in four weeks. The S&P 500 hit new all-time highs by February 1991 — less than four months after the bottom.
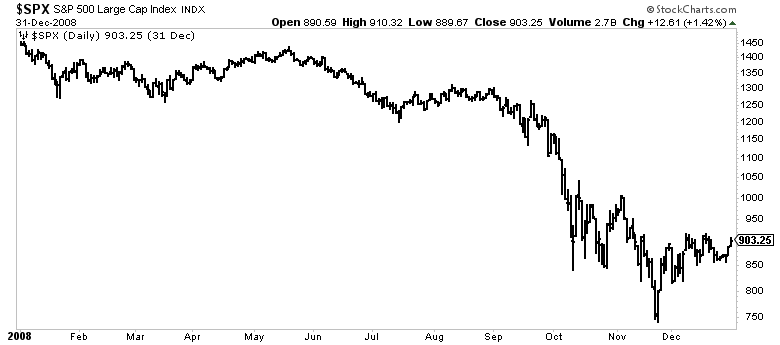
2008 — The $147 Barrel
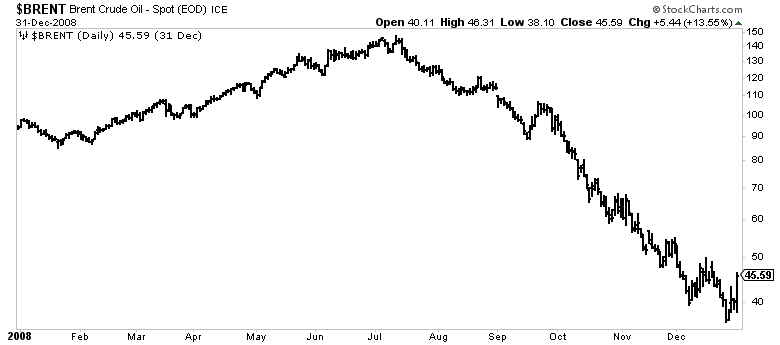
Oil surged from $95 to $147 between January and July 2008 — a 55% spike driven by surging global demand and supply fears. But this shock didn't happen in isolation. It coincided with the unraveling housing market and a seizing financial system.
Here's the part most people forget: after peaking at $147 in July, oil collapsed to $32 by December — a 78% crash in five months. Economic activity cratered so fast that oil demand collapsed with it — overwhelming any supply story. When the real economy breaks, commodities follow it down.
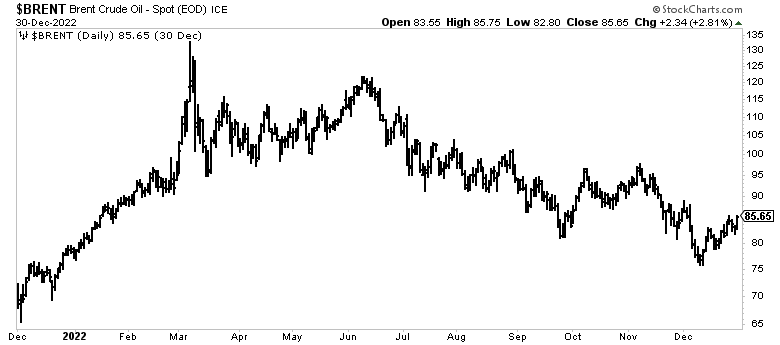
2022 — Russia/Ukraine
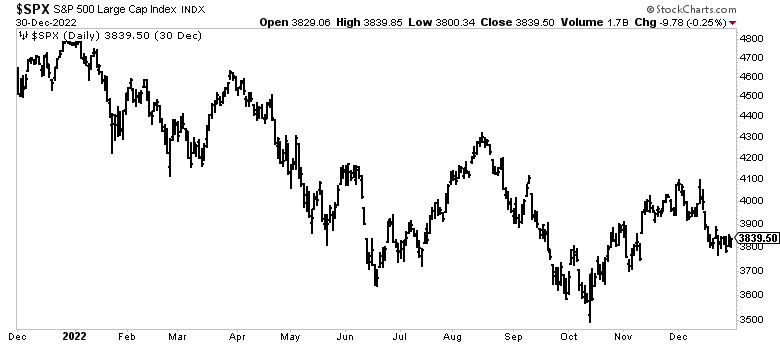
Russia's invasion of Ukraine on February 24, 2022 sent oil from $76 to $130 in about two weeks — a 71% spike. But unlike 1990, the oil shock didn't resolve quickly. And unlike 2008, the economy wasn't breaking under its own weight. The dominant driver was the Fed's aggressive rate-hiking cycle — the oil shock amplified an already severe inflation problem (CPI was already at 7.9% before the invasion), forcing even more tightening.
Oil eventually rolled over, falling back to $75 by late 2022 as recession fears grew and Russian oil found new buyers through India and China. But the damage was done — the S&P 500 fell 25.4% from January to October 2022, a drawn-out 10-month decline with no clean resolution point like 1991. The recovery took months, not weeks.
| Event | Oil Move | $SPX Drawdown |
|---|---|---|
| 1990's Gulf War | $17 -> $40 -> $15 | -20% |
| 2008 Financial Crisis | $90 -> $145 -> $45 | -55% |
| 2022 Russia / Ukraine | $70 -> $135 -> $85 | -25% |
| 2026 Iran (So Far) | $60 -> $92 | <5% |
The pattern: Oil shocks alone don't cause market crashes. The severity depends on what else is broken. In 1990, the economy was already weakening. In 2008, the financial system was failing. In 2022, the Fed was tightening into elevated inflation. A pure oil shock with a healthy financial system tends to produce a correction (15-20%), not a crash.
The uncomfortable question for 2026: is something else broken?
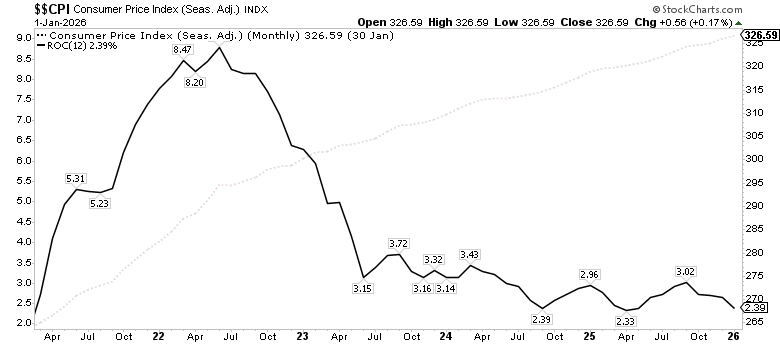
The Inflation Problem
Energy makes up roughly 7-8% of the CPI basket. But the impact of an oil shock goes far beyond the gas pump.
The direct hit: A $10/barrel increase in crude oil translates to roughly $0.25/gallon at the pump within 2-6 weeks. The current $23/barrel spike means gas prices are likely headed about $0.55-0.60/gallon higher in the coming weeks, all else equal.
The indirect hit: Oil is an input cost for virtually everything. Agriculture runs on diesel and natural gas-derived fertilizer. Manufacturing runs on electricity and petrochemicals. Logistics runs on diesel. Federal Reserve research shows the indirect effects can roughly double the total CPI impact over 3-12 months.
The math: A sustained $20+ increase in oil prices typically adds 0.4 to 1.0 percentage points to annualized headline CPI. Analysts at Wolfe Research have estimated the impact at roughly 0.4 percentage points on headline CPI and a 0.1% drag on GDP for every $20/barrel move in crude.
This matters because CPI was at 2.4% before the oil shock. If oil stays near $90, headline inflation is headed higher — possibly back above 3% — right when the Fed thought the disinflation trend was intact.
The Fed's Choice
Winners and Losers
| Sector | Return Since Conflict Start (Feb 27) |
|---|---|
| Energy | +1.16% |
| Comms | -0.50% |
| Tech | -1.06% |
| Financials | -1.67% |
| Discretionary | -2.07% |
| Utilities | -2.07% |
| Real Estate | -2.17% |
| Industrials | -4.06% |
| Health Care | -4.68% |
| Staples | -4.70% |
| Materials | -6.65% |
Want the Signals, Model Portfolio, and Backtests?
This is the free analysis. The full dashboard gives you regime signals, monthly stock rankings, position sizing to the dollar, and 95+ years of backtested data.
Get AccessGet Weekly Market Analysis Like This — Free
Data-driven insights on macro trends, momentum, and what we're watching. Delivered to your inbox every week.